Sunday, March 23, 2014

TOOL WE HAVE BEEN WAITING FOR? DART Tools...


Good day!
Long time I have been waiting for a tool something like this and I think would be very helpful to troubleshoot Servers which are down with blue screen and we ended up rebuilding servers without knowing the root cause or even trying a way to bring it online…

So let see what this tool can give us when my Server is down with Blue screen and not booting up…

a.       Registry Editor – Self explanatory – you can make any modification if you think registry change is cause of outage..
b.      Locksmith – you forgot local user name and password, well use this to unlock it..
c.       Crash Analyzer – I think this is the best tool of all, how many time we rebuild server after BSOD and couldn't find a root cause. This was the hardest part for me to get this working because it requires Symbols to analyze dump file..
d.      Disk commander – If you think master boot record problem, use this to fix MBR
e.      Disk wipe – be cautious J
f.        Computer Management – guess what Server is down, but using this tool you can check the event logs.. how cool is that.. and you can go to drivers, services and you can stop/start them if you think any drivers issue....
g.       Explorer – we know what it does J
h.      Solution Wizard – will walk through question and answer and provide you with possible solution for a problem.. give a try
i.         TCP/IP Config – self explanatory
j.        Hotfix Uninstall – I think this is the 2nd best tool of the lot after Crash Analyzer, we can uninstall a hotfix if we think that cause the BSOD. Note is we can uninstall only 1 hotfix at a time…
k.       SFC Scan – if you think any OS\dll configuration missing or corrupt  just run this..
l.         Standalone System Sweeper – hope we never have to use this, but it’s there if you think the Server is attacked by Virus and you can try cleaning it..


What do we need:
1.MDOP tool     - http://www.microsoft.com/en-us/windows/enterprise/products-and-technologies/mdop/default.aspx  only  for MSDN/Tech net subscription
2. Install DART tools from MDOP depending on which Operating system you want to troubleshoot Note: 2008 ISO will not boot to x86 OS.. so you need to create ISO depending on OS version.
3. Debugging tools and symbols - http://windowsrunbook.blogspot.in/
4. Windows OS ISO.
5. How to create this Tool ISO – excellent article - http://blogs.technet.com/b/shanecothran/archive/2009/11/09/how-to-create-a-erd-commander-2009-boot-disk.aspx which goes over step by step.. but I will see if I can send out with screen shot sometime later..

So how does it work:


Steps:
Mount the ISO in the ILO and boot the Server using the ISO..


1.Depending on the situation you troubleshooting , you can pick yes or no for both step 1 and 2.

2.

3.

4. It should pick the existing Windows 2008\2008 R2\2008 R2 SP1 installed directory, select it and click Next..

5. Click Microsoft Diagnostics and Recovery Tool set


6. I have included all the tools which we would need during a outage….


So let me show up how to analyze a memory dump:

1.       Click on Crash Analyzer
2.       Un-check the check box which says Automatically configure tools.. and click Next..


         Leave the path as it is.. and click Next


1.       Click symbol files located in this directory and assign the path as x:\Symbols and click Next


1.       Select the Dump file.. and click Next.. you must be thinking does this really work J


        You ready for output.. ..  J how cool is that.. just 4 clicks and we analyzed a dump..The next step is for SA who want to see !analyze-v output ,debug arguments and !Process output..


          Click on Details and go to Advance tab and confirm that Symbols are loading, if not then there are no symbols for this dump.
Note: Symbols loaded are for 2008 R2 SP1 so we will only able to test dump for this Server version. Also I am not sure how many windows 2008 R2 servers we have 


Scroll down then you will see the bug check arguments and !analyze –v output, how cool is that J


Sunday, March 16, 2014

HOW TO DEBUG A DUMP,WHERE TO GET SYMBOL FILES...????

Note: I am posting this blog for Windows Administrator supporting in a corporate environment on how to download debugging tools and setup a Symbols share path and use it for analyzing Kernel dump

We always wanted to start debugging as soon as we see a Kernel dump, but what do we need
1. Debugging tools
2. Symbols

So let see how to get debugging tools…

1. Click on the link (http://www.microsoft.com/en-in/download/details.aspx?id=8279) and click download
2. We don’t want to install it, what we want to do is get the MSI files so that we can copy to any servers... so during the option deselect everything and just select as below
 

3. After install is complete go to install location C:\Program Files\Microsoft SDKs\Windows\v7.1\Redist\Debugging Tools for Windows and you will see 3 files..
  

4. Copy debg_amd64.msi and dbg_x86.msi and to a separate folder, let says ex... c:\debug


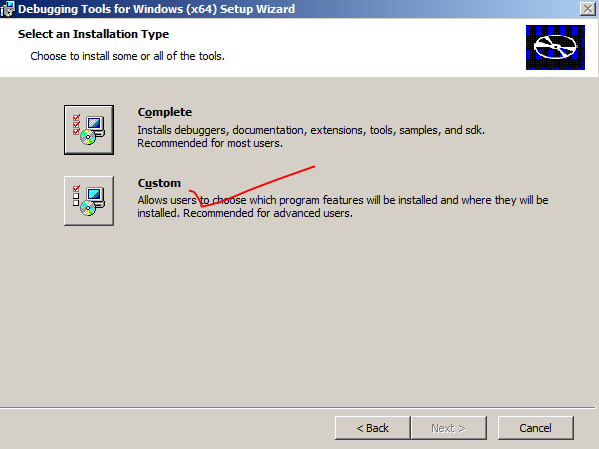
5. Now we need to extract the msi, so we just say install the msi and when shows installation option, click on custom and click next..


6. Click browse and change path to c:\debug and create a folder call debuggers_x64 and point to that… click next… it basically extracts…


7. Follow the same steps and extract dbg_x86.msi, when done you will see 2 folders..


8. So you got the debug tools for  x86/x64 machines.

9. Now that we got debugging tools let get the Symbols..
  
Windows 2008 R2 SP1:
  
Windows 2003 x86 with SP2:


For anything else use the below link and download it…

Just click the msi and extract to specific location.. Like example below
 
10. Now share the debug folder so that you can use the symbols from anywhere…

11.
Now we know what we need, will show you how to start your first debug..

Before you start thinking to debug, you need to know what Operating system and what architecture Version 64 bit/32bit you are going to debug?

If the memory.dmp file is too big then its better off doing it on the Server or you want to do it from some other server...for both the process steps are the same

12. So copy the required debugger for the Operating system and click on WINDBG.exe


Note: you need to debug a 64bit dump in 64 bit debugger and vice versa…

13.   Click File and click on Symbol File path..


14.   Depending on what OS bit version, you need to put that Symbol file path and click OK

SRV*\\Servername\debug\Symbols_2003x86*http://msdl.microsoft.com/download/symbols   - x86
SRV*\\Servername\debug\Symbols_2008x64sp1*http://msdl.microsoft.com/download/symbols  -x64 windows 2008R2 sp1


15.   Click File and click on Open Crash dump and locate the path of kernel dump file (ex. C:\windows\Memory.dmp) and click yes
See Loading symbols if it can’t load symbols it will say that no symbols was loaded…

Note: you see 2 Error because this symbols will not have symbols for 3 rd party drivers like Symantec ..


16.   All you have to do is click on !analyze –V and wait.. .. when done scroll all the way down and look for something like below ….


You just finished  first level debugging.. there is more to it.. and this is the starting process.. so go start debugging…