Note: I am posting this blog for Windows Administrator
supporting in a corporate environment on how to download debugging tools and setup
a Symbols share path and use it for analyzing Kernel dump
We always wanted to start debugging as soon as we see a
Kernel dump, but what do we need
1. Debugging tools
2. Symbols
So let see how to get debugging tools…
1. Click on the link (http://www.microsoft.com/en-in/download/details.aspx?id=8279)
and click download
2. We don’t want to install it, what we want to do is get
the MSI files so that we can copy to any servers... so during the option deselect
everything and just select as below

3. After install is complete go to install location C:\Program
Files\Microsoft SDKs\Windows\v7.1\Redist\Debugging Tools for Windows and you
will see 3 files..

4. Copy debg_amd64.msi and dbg_x86.msi and to a separate folder,
let says ex... c:\debug

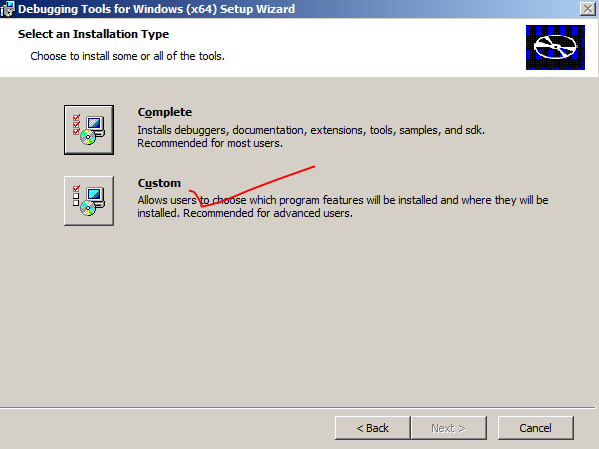
5. Now we need to extract the msi, so we just say install
the msi and when shows installation option, click on custom and click next..
6. Click browse and change path to c:\debug and create a
folder call debuggers_x64 and point to that… click next… it basically extracts…

7. Follow the same steps and extract dbg_x86.msi, when done
you will see 2 folders..

8. So you got the debug tools for x86/x64 machines.
9. Now that we got debugging tools let get the Symbols..
Windows 2008 R2 SP1:
Windows 2003 x86 with SP2:
For anything else use the below link and download it…
Just click the msi and extract to specific location.. Like
example below

10. Now share the debug folder so that you can use the symbols from anywhere…
11.
Now we know what we need, will show you how to start your
first debug..
Before you start thinking to debug, you need to know what
Operating system and what architecture Version 64 bit/32bit you are going to
debug?
If the memory.dmp file is too big then its better off doing
it on the Server or you want to do it from some other server...for both the process
steps are the same
12. So copy the required debugger for the Operating system
and click on WINDBG.exe

Note:
you need to debug a 64bit dump in 64 bit debugger and vice versa…
13. Click
File and click on Symbol File path..

14. Depending
on what OS bit version, you need to put that Symbol file path and click OK
SRV*\\Servername\debug\Symbols_2003x86*http://msdl.microsoft.com/download/symbols
- x86
SRV*\\Servername\debug\Symbols_2008x64sp1*http://msdl.microsoft.com/download/symbols
-x64 windows 2008R2 sp1

15. Click
File and click on Open Crash dump and locate the path of kernel dump file (ex.
C:\windows\Memory.dmp) and click yes
See Loading symbols if it can’t load symbols it will say
that no symbols was loaded…
Note: you see 2 Error because this symbols will not have
symbols for 3 rd party drivers like Symantec ..

16. All
you have to do is click on !analyze –V and wait.. .. when done scroll all the
way down and look for something like below ….

You just finished first level debugging.. there is
more to it.. and this is the starting process.. so go start debugging…
No comments:
Post a Comment